A Research Breakdown of Order Flow, VWAP Reversion, Seasonality, and Market Regimes
View the Full Notebook on Github
Crypto Microstructure Analysis Notebook
This Jupyter notebook contains the complete code, charts, and results behind the BTC USDT microstructure research. You can open the fully interactive notebook using the link below.
➜ View the Interactive NotebookThis study examines the microstructure behavior of the BTC USDT market between 2025-11-27 and 2025-12-10, using 18,662 one-minute observations. The goal is to understand whether short-horizon order flow matters, whether prices revert toward VWAP, whether specific minutes of the day reliably outperform others, and whether the market transitions between identifiable trading regimes. The results show that BTC USDT contains meaningful structure despite its volatility. Some behaviors resemble equity microstructure, while others more closely resemble FX-style rapid information absorption.
1. Market Overview
Across the sample, BTC USDT displays:
- Mean 1-minute return: 0.810 bps
- Annualized volatility: 258.63%
- Average spread: 7.70 bps
- Average volume per bar: 152 units
The combination of extremely high volatility and relatively tight spreads makes BTC USDT an interesting market for intraday quantitative strategies.
The objective of this study is to determine whether stable and predictable microstructure patterns exist underneath this volatility.
2. Order Flow Imbalance Predictability
What We Are Testing
Order flow imbalance measures whether buy pressure or sell pressure dominates in each minute.
The test asks: Does buying pressure lead to price increases in the next few minutes?
If order flow predicts returns, it can be used for alpha signals, execution timing, or inventory risk control.
Why We Are Testing It
In equity microstructure, order flow often predicts immediate price changes.
Crypto markets may behave differently, so this assumption must be tested empirically rather than assumed.

What the Numbers Show
At short horizons, imbalance offers almost no predictive value:
- 1-minute correlation: 0.0044
- 5-minute correlation: 0.0070
- 15-minute correlation: −0.0036
- 30-minute correlation: −0.0057
All of these are extremely small and statistically meaningless.
However, the 60-minute horizon shows a clear effect:
- 60-minute correlation: −0.0185
This correlation is small in magnitude but statistically meaningful.
Interpretation
The imbalance results tell a consistent story:
- BTC USDT rapidly absorbs order flow, leaving no useful short-term signal.
- But after long periods of strong buying, the market tends to mean revert slightly downward over the next hour.
This is not an intraday alpha signal by itself, but it is important for risk management: holding directional exposure following heavy flow may lead to drift against the position.
3. VWAP Mean Reversion Behavior
What We Are Testing
VWAP represents the average price weighted by traded volume.
The test evaluates whether the market price reliably reverts back toward VWAP, and how fast that reversion occurs.
Why We Are Testing It
VWAP anchoring is widely used in hedge fund microstructure models.
If prices drift away from VWAP and reliably revert, this creates a stable, repeatable alpha framework.

What the Numbers Show
The characteristics are extremely strong:
- Autocorrelation of VWAP deviation: 0.9752
- Estimated half-life: 27.62 minutes
- VWAP signal strength: 0.0013
Interpretation
A deviation persistence of 0.9752 is exceptionally high, meaning VWAP deviation is a smooth, slow-moving state variable.
The half-life of 27.62 minutes is ideal for intraday mean reversion strategies: long enough to be tradeable, short enough to realize the edge within a reasonable window.
Among all signals studied, VWAP deviation is the most reliable and actionable.
4. Intraday Seasonality
What We Are Testing
Seasonality asks whether certain minutes of the day consistently produce higher or lower returns.
Even though crypto trades 24 hours a day, liquidity cycles, session transitions, and human activity can still create predictable time-of-day effects.
Why We Are Testing It
Time-of-day effects help improve trade execution:
If specific minutes have reliably positive drifts or very low volatility, traders can time entries, exits, and risk adjustments more effectively.

What the Numbers Show
Across 1,440 minutes in a day:
- 80 minutes show statistically significant expected returns
- This equals 5.6% of the day
- The peak Sharpe ratio observed is 23.06
Interpretation
Seasonality is real in BTC USDT.
It is not strong enough to support a standalone strategy, but it provides valuable execution timing advantages.
High-Sharpe minutes offer favorable trade windows, while negative minutes suggest periods to reduce risk or delay execution.
5. Market Regime Detection
What We Are Testing
Regime analysis explores whether the market transitions between distinct states, each with unique volatility, spread, and return characteristics.
Clustering and PCA allow us to identify these latent states directly from the data.
Why We Are Testing It
Returns, volatility, and liquidity often behave differently depending on the environment.
Regime awareness helps traders adjust position sizing and choose the right signal for the right state.

What the Numbers Show
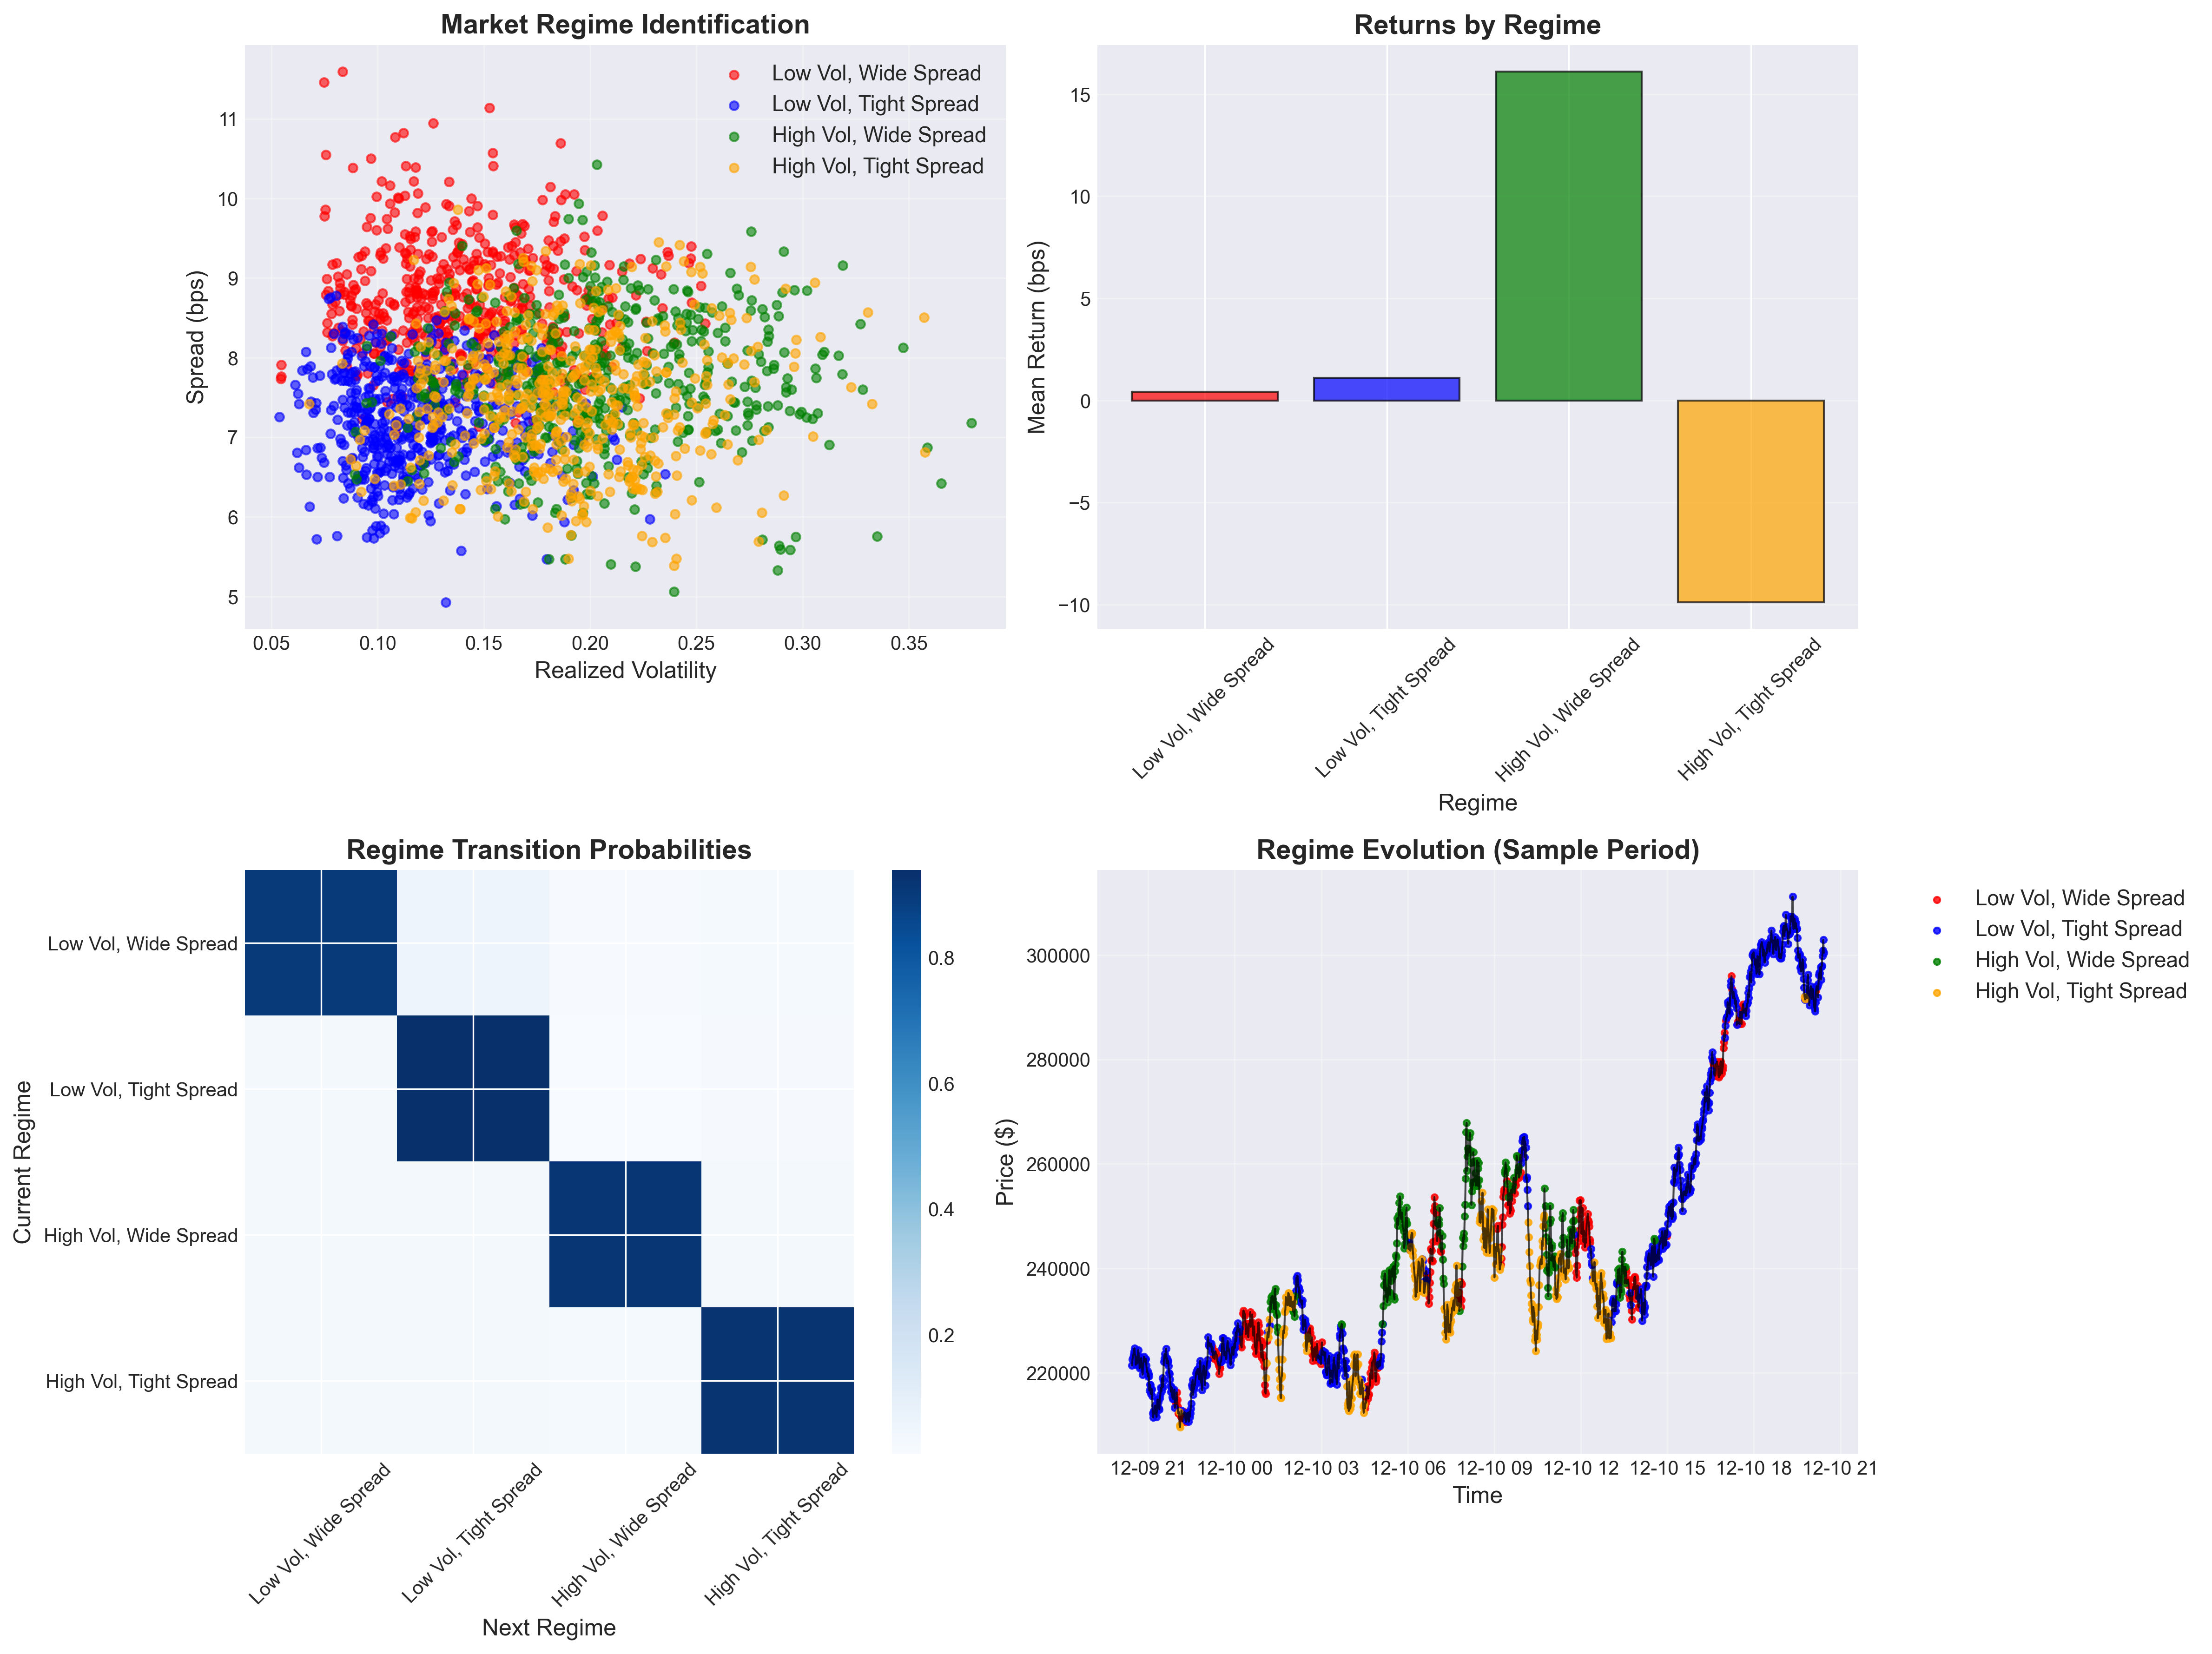
Four clear regimes emerge:
Regime 0
- Volatility: 14.21%
- Spread: 8.74 bps
- Mean return: 0.43 bps
- Frequency: 24.1%
Regime 1
- Volatility: 11.93%
- Spread: 7.16 bps
- Mean return: 1.10 bps
- Frequency: 38.7%
Regime 2
- Volatility: 20.84%
- Spread: 7.68 bps
- Mean return: 16.11 bps
- Frequency: 15.3%
Regime 3
- Volatility: 18.92%
- Spread: 7.54 bps
- Mean return: −9.88 bps
- Frequency: 21.9%
The difference between the best and worst regimes is 11.49 bps of return.
Interpretation
Regime 2 is a momentum-friendly state, where high volatility and wide spreads coincide with strong positive returns.
Regime 3 shows the opposite: high volatility with negative drift, indicating stressed or liquidity-imbalanced conditions.
Regime 0 and Regime 1 are calmer and tend to favor mean reversion.
These structural differences strongly support a regime-aware trading framework.
6. Synthesis and Trading Implications
When combining all components of the study, a cohesive picture emerges:
- Order flow imbalance does not predict short-term returns but reveals slow mean reversion at the hour scale.
- VWAP deviation is the strongest and most reliable intraday signal due to its high persistence and ideal half-life.
- Seasonality shows that certain minutes repeatedly generate favorable or unfavorable returns, enabling execution optimization.
- Regimes exhibit large differences in expected returns and volatility, suggesting that trading strategies should adapt dynamically to market state.
BTC USDT may appear noisy, but beneath the volatility lies a set of clear, statistically grounded microstructure patterns.
These patterns help inform alpha design, execution timing, and risk management in a professional trading framework.
Appendix: Key Findings Table
| Category | Metric | Value |
|---|---|---|
| Market Stats | Total Bars | 18,662 |
| Market Stats | Mean 1m Return | 0.810 bps |
| Market Stats | Annualized Volatility | 258.63% |
| Order Imbalance | 1m Correlation | 0.0044 |
| Order Imbalance | 5m Correlation | 0.0070 |
| Order Imbalance | 15m Correlation | -0.0036 |
| Order Imbalance | 30m Correlation | -0.0057 |
| Order Imbalance | 60m Correlation | -0.0185 |
| VWAP Reversion | Deviation Autocorrelation | 0.9752 |
| VWAP Reversion | Half-Life | 27.62 minutes |
| VWAP Reversion | Signal Strength | 0.0013 |
| Seasonality | Significant Minutes | 80 |
| Seasonality | Percentage Significant | 5.6% |
| Seasonality | Peak Sharpe | 23.06 |
| Regimes | Best Regime Return | 16.11 bps |
| Regimes | Worst Regime Return | -9.88 bps |
| Regimes | Return Spread | 11.49 bps |